- How do I cite the Synteny Database?
Please cite the following article:
J.M. Catchen, J.S. Conery, and J.H. Postlethwait. (2009) Automated identification of conserved synteny after whole genome duplication. Genome Research, 19: 1497-1505. [reprint]
- What is the Synteny Database?
The Synteny Database is a system built to detect conserved synteny -- the tendency of neighboring genes to retain their relative positions and orders on chromosomes over evolutionary time (synteny: syn, same; tene, thread). Given a source genome and an outgroup genome the Synteny Database can detect regions of conserved synteny within the source genome (paralogons), or between the source and outgroup genomes. The system was built with special care to detect paralogons originating from whole-genome duplication. The Synteny Database is meant to aid the study of the evolutionary history of gene families across multiple lineages.
- What are the source and outgroup genomes?
The Synteny Database detects conserved synteny by examining datasets generated by a reciprocal best hit analysis. Our Reciprocal Best Hit (RBH) Analysis Pipeline identifies paralogous gene groups in a source genome and then anchors those gene groups to an ortholog in an outgroup genome using a BLAST-based approach. Paralogous groups are naturally created by the pipeline relative to the last whole genome duplication present in the source genome but absent in the outgroup genome.
Given a gene name, the Synteny Database will search the source genome for paralogous clusters containing the gene as a member, and it will search between the source and outgroup genome for orthologous clusters containing the specified gene as a member.
- What are the versions of the reference genomes used in the Synteny DB?
There are currently two main datasets in use by the Syntney DB. The default data set is based on data obtained primarly from Ensembl version 52. In March 2010 the Synteny DB was rebuilt using Ensembl version 56. This newer dataset can be used by selecting Ens56 from the Variant menu. In the near future, Ens56 dataset will be made the default, with the older dataset retained for ongoing projects.
Ens70 dataset
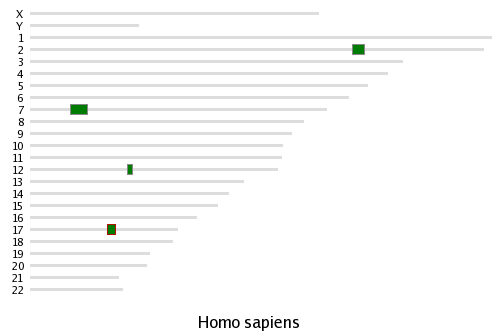
ID Organism Reference Genome Version Ensembl Version hsa Homo sapiens GRCH 37 Ensembl 70 mmu Mus musculus grcm38 p1 Ensembl 70 gac Gasterosteus aculeatus BROAD S1 Ensembl 70 gga Gallus gallus washuc2 Ensembl 70 tni Tetraodon nigroviridis v8 Ensembl 70 ola Oryzias latipes HDRR Ensembl 70 dre Danio rerio Zv9 Ensembl 70 tru Takifugu rubripes FUGU4 Ensembl 70 xtr Xenopus tropicalis JGI 4.2 Ensembl 70 lac Latimeria chalumnae latcha1 Ensembl 70 loc Lepisosteus oculatus 1 Ensembl 70 xma Xiphophorus maculatus WashU-JHP 4.4.2 Ensembl 70 cin Ciona intestinalis KH Ensembl 70 - Why can’t the Synteny Database find my gene?
There are two possibilities:
-
The system may not understand your gene identifier. The Synteny Database obtains most of its data from Ensembl and it therefore relies on the identifiers that Ensembl assigns to the genes. If the system can’t find your gene, it may help to search for it first on the Ensembl website.
The system does accept Ensembl ID numbers, such as ENSG00000068793, as well the Ensembl external ID, which may be a HUGO identifier, an NCBI RefSeq, a Zfin ID, or another standard ID, depending on how Ensembl annotated the particular genome.
-
The system understands your gene identifier, but was not able to find a reciprocal best hit for your gene, or, it found an RBH but was not able to place it into a larger conserved cluster. (You can look up the RBH results for your gene to determine the details).
If the system does not have results for your gene, there are still two basic approaches you can pursue. First, you can find a near-neighbor and use that gene as a proxy. In the RBH results interface, you can filter the results to look at your gene, as well as the neighboring genes on the chromosome. If there are good results for one of these neighboring genes, you can choose to use it as a proxy.
A second approach is to browse the set of clusters. On the main Synteny Database page, scroll to the Browse the Synteny Database section. Enter the region your gene is located on and the system will display any clusters from that region.
-
- What is the significance of the sliding window size?
The Synteny Database uses a sliding window algorithm to detect regions of conserved synteny within the source genome and between the source and outgroup genomes. Currently, the system is populated with data generated using four sliding window sizes (measured in contiguous gene number, not physical distance): 25, 50, 100, and 200 genes. So, when searching for conserved regions using a 25-gene sliding window, when the system finds a pair of orthologs or paralogs, it will search the next 25 contiguous genes looking for an additional pair of orthologs or paralogs and then will stop searching.
Simulations show that a 50-gene sliding window produces the most statistically significant clusters, while a 200-gene window can sometimes produce clusters by chance alone. One should consider the evolutionary distance between the source and outgroup organism when choosing a window size. For closely related species, such as human and mouse, or stickleback and medaka, a 25 or 50-gene window will usually be the most appropriate. When the genomes are further diverged, such as with zebrafish and human, a 100-gene window may work best.
A 200-gene window is most useful for exploring large regions of the genome for weak conservation. Often, a large region found using a 200-gene window will exist as several smaller clusters using a smaller window size.
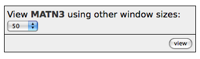
When viewing the details for a set of clusters, the system provides you with the option of viewing your gene in a cluster generated by another sliding window size if such clusters are available (the control is shown to the right).
- What are composite clusters?

A composite cluster for human HOXB4 using amphioxus as an outgroup.Due to the nature of the sliding window analysis, the pipeline discovers conserved syntenic regions in a pairwise fashion. One effect of this strategy is that two or more logical clusters can overlap in the same physical space on a single chromosome. For example, if in a hypothetical genome a single region of chromosome 2 has genes that are paralogous to genes on chromosome 10, and some of those same genes are also paralogous to genes on chromosome 12, the Synteny Database reports four rather than three clusters -- one pair representing the conservation between chromosomes 2 and 10 and a second pair representing the conserved regions on chromosomes 2 and 12.
The Synteny Database searches all pairs of clusters and for those clusters that have overlapping membership, the system consolidates them into a composite cluster. In the above example, the system would find that some of the same genes are in both clusters that occupy chromosome 2. The system would merge these four clusters into three, merging the overlapping regions on chromosome 2.
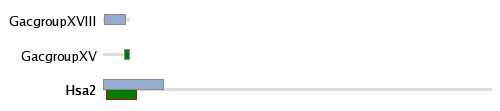
- How do I interpret a cluster map image?
Whenever you choose to view a syntenic cluster from the database, the Synteny Database will generate a cluster map showing the syntenic clusters you are viewing in the context of the full chromosomes they reside on.
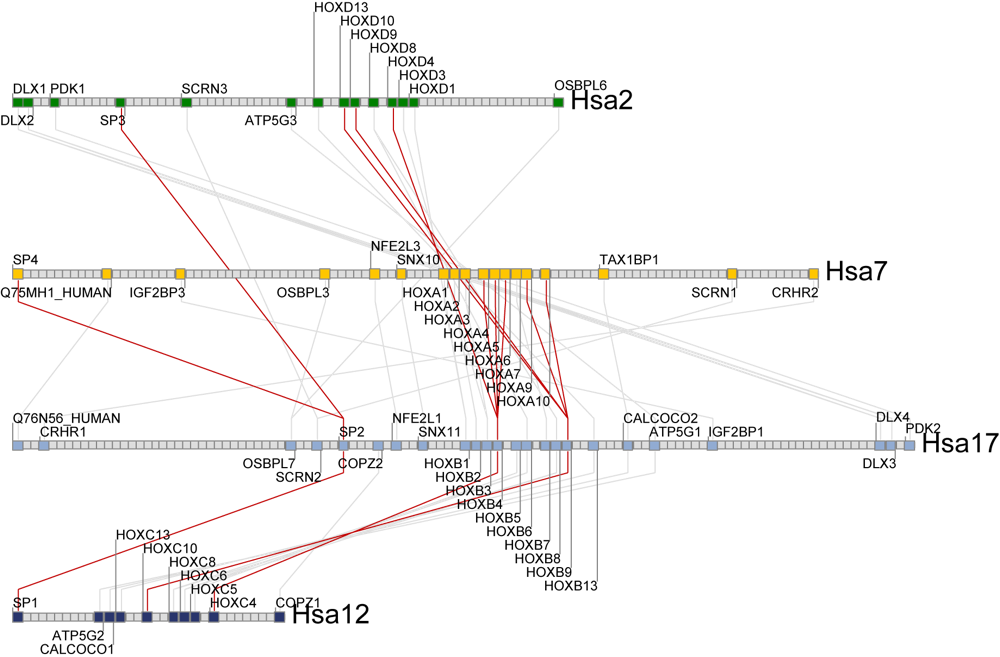
The human HOXB4 composite cluster
map using an amphioxus outgroup.A set of green rectangles are drawn representing the region of conserved synteny being viewed. These rectangles are drawn according to their physical scale and position on the chromosome. One or more sets of light blue rectangles may also be drawn, representing clusters that have genes in common with the clusters represented by the green rectangles. In the HOXB4 example to the right, the cluster map shows the human HOX composite cluster (generated using amphioxus as an outgroup). Visible are the four major regions containing the HOX genes on Hsa2, Hsa7, Hsa12, and Hsa17.
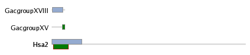
The Hsa2/GacXV cluster map for the MATN3 gene.In the example to the right, the MATN3 cluster (green rectangle) is shown near a telomere of human chromosome 2 (Hsa2). Its companion is shown at the tip of stickleback chromosome XV (GacXV). A second set of clusters (blue rectangles) are shown on Hsa2 and stickleback cluster XVIII (GacXVIII). Some of the genes that are members of the MATN3 Hsa2/GacXV clusters are also members of the Hsa2/GacXVIII cluster. The green and blue rectangles together represent a single region on Hsa2 along with two stickleback paralogons (on GacXV and GacXVIII) produced by the R3 whole genome duplication.
The cluster map is clickable, allowing the user to view the other clusters found.
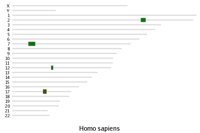
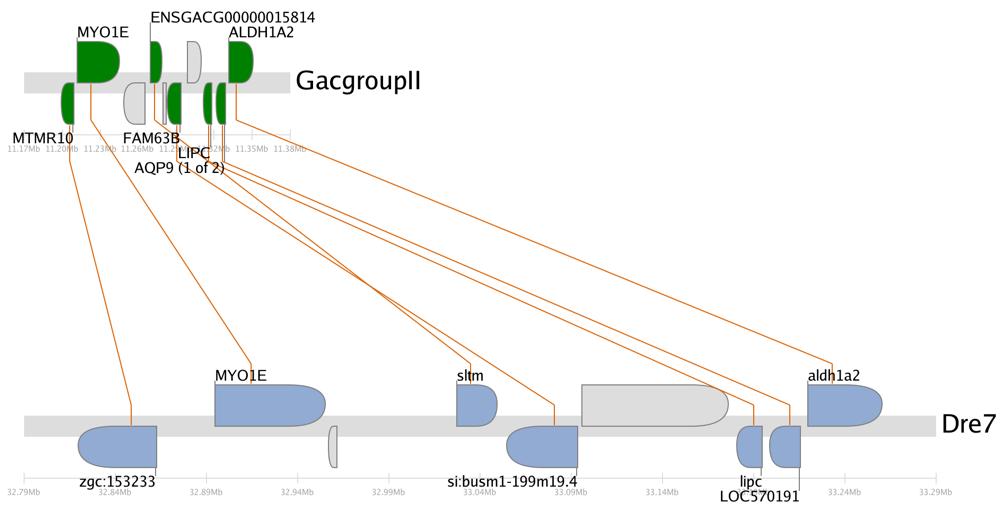
- How do I interpret a synteny trace image?
The zebrafish/stickleback aldh1a2 synteny trace.A synteny trace is a naturally scaled image that draws genes on their physical locations on the chromosomes, showing them on the proper strand, actual length, and in the proper orientation. Lines connect orthologs or paralogs together. Genes colored grey are located within the same region of the cluster, but are not members of the cluster (peripheral genes).
Clicking on the PDF icon downloads a document that can be imported into image editing software, such as Adobe Illustrator, for further manipulation.
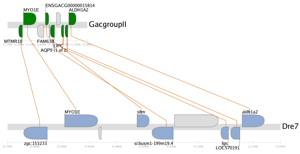
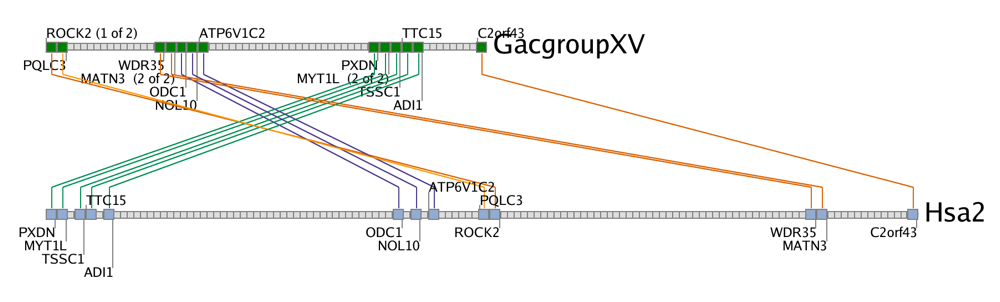
- How do I interpret a gene trace image?

The stickleback/human MATN3 gene trace.A gene trace is a scale-free representation of a set of orthologous or paralogous clusters. Genes are drawn as squares, with their order but not their physical location preserved. Colored squares are members of the cluster while grey squares represent genes in the interval but that do not have orthologs or paralogs in the other segment (the Synteny Database refers to these as peripheral genes).
Lines connecting squares between the two clusters represent orthologous or paralogous gene pairs. These lines are colored according to how they were detected by the sliding window algorithm. Lines of the same color, referred to as subclusters, were detected by the same pass of the sliding window and generally indicate strong local conservation. Comparing different subclusters easily allows the user to discern patterns such as inversions and transpositions of sets of genes between the two chromosomes.
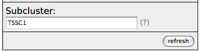
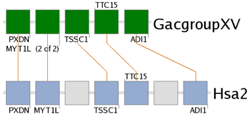
The TSSC1 subcluster of the stickleback/human MATN3 gene trace.By entering the name of a gene in one of these subclusters on the cluster detail page, such as shown to the right with the TSSC1 gene, the Synteny Database will redraw the cluster, only showing the subcluster containing TSSC1. Multiple genes can be specified to draw multiple subclusters. Looking at subclusters can be particularly useful when trying to view a very large cluster.
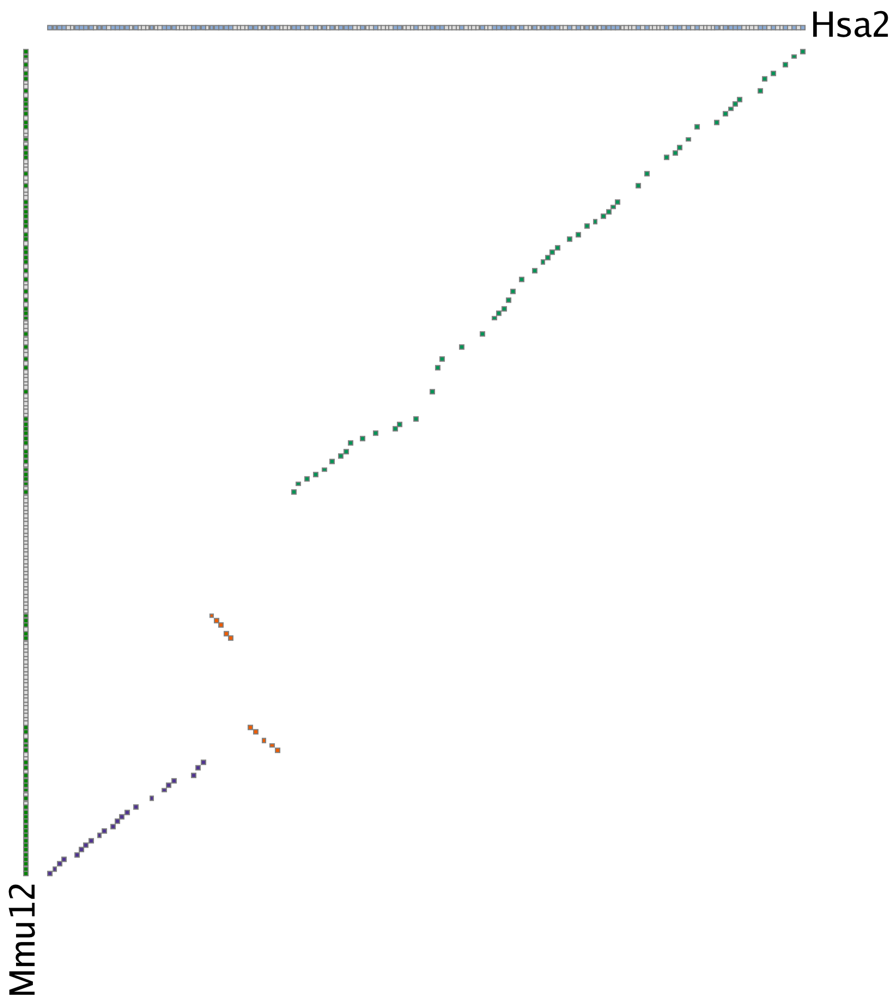
- How do I interpret a gene homology matrix image?
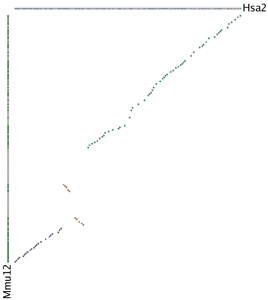
The human/mouse MATN3 gene homology matrix.In a gene homology matrix image the genes from one cluster are placed along the X-axis of the plot while the genes from the other cluster are placed along the Y-axis. Orthologs or paralogs are marked at their intersection; well-conserved synteny appears as a diagonal line in the plot and inversions of genes between the two chromosomes are perpendicular to one another. A gene homology matrix is most useful for closely related species; to the right we show the human/mouse MATN3 gene homology matrix. The sliding window detected the cluster in three separate passes, and the large inversion dividing the two halves of the cluster is visually obvious (colored yellow).
maintained by: jcatchen
last updated: Thu Aug 25 20:24:21 PDT 2016
last updated: Thu Aug 25 20:24:21 PDT 2016